Revenio Group
27
EUR
-2.81 %
REG1V
NASDAQ Helsinki
Medical Equipment & Services
Health Care
14,013 following
-2.81%
-17.78%
-15.09%
-5.99%
-0.59%
+12.41%
-53.49%
+5.26%
+1,321.05%
www.reveniogroup.fi
Revenio is a medical technology company. Within the Group, there is research and development of pressure measurement technology that is used in the treatment of a number of diseases such as glaucoma, osteoporosis, skin cancer, and asthma. Operations are held worldwide and are run via most subsidiaries, each with a business focus. The company's head office is located in Vantaa.
P/E (adj.) (24e)
35.42
EV/EBIT (adj.) (24e)
26.53
P/B (24e)
6.63
Dividend yield-% (24e)
1.34 %
Target price
32.00 EUR
Recommendation
Accumulate
Updated
1.11.2024
NASDAQ Helsinki
REG1V
Daily low / high price
27 / 28.02
EUR
Market cap
720.39M EUR
Turnover
335.78K EUR
Volume
12K
Business risk
Valuation risk
Current
Previous
Latest research
Extensive report
Inderes' extensive report is an investor's handbook on customer companies covered by our research.
The latest extensive report was released
Read the reportAnalyst
Juha Kinnunen
Analyst
Latest videos
Financial calendar
Annual report
2025-02-13
General meeting
2025-04-10
Interim report
2025-04-29
Interim report
2025-08-07
Interim report
2025-10-30
Forum updates
Better late than never! I’ll try to be active now and compensate historical lapses
5/28/2024, 9:30 AM💙 3
Income statement
2020 | 2021 | 2022 | 2023 | 2024e | 2025e | 2026e | 2027e | |
---|---|---|---|---|---|---|---|---|
Revenue | 61.1 | 78.8 | 97.0 | 96.6 | 104.1 | 120.7 | 141.5 | 161.4 |
growth-% | 23.4 % | 29.1 % | 23.1 % | -0.5 % | 7.8 % | 16.0 % | 17.2 % | 14.0 % |
EBITDA | 21.7 | 25.7 | 33.1 | 30.3 | 30.0 | 38.5 | 48.4 | 55.0 |
EBIT (adj.) | 19.2 | 24.5 | 30.9 | 28.5 | 26.8 | 35.3 | 44.4 | 51.4 |
EBIT | 17.1 | 22.1 | 29.7 | 26.3 | 25.0 | 34.3 | 43.4 | 50.5 |
Profit before taxes | 16.7 | 22.1 | 29.1 | 25.4 | 24.7 | 34.5 | 44.2 | 52.0 |
Net income | 13.3 | 17.3 | 21.8 | 19.1 | 18.5 | 26.6 | 34.0 | 40.0 |
EPS (adj.) | 0.58 | 0.74 | 0.86 | 0.80 | 0.76 | 1.04 | 1.32 | 1.54 |
growth-% | 22.5 % | 27.2 % | 16.9 % | -7.5 % | -4.7 % | 36.3 % | 26.7 % | 16.8 % |
Dividend | 0.32 | 0.34 | 0.36 | 0.38 | 0.36 | 0.54 | 0.72 | 0.90 |
Dividend ratio | 63.7 % | 52.4 % | 43.9 % | 52.9 % | 52.0 % | 54.0 % | 56.0 % | 60.0 % |
Profitability and return on capital
2020 | 2021 | 2022 | 2023 | 2024e | 2025e | 2026e | 2027e | |
---|---|---|---|---|---|---|---|---|
EBITDA-% | 35.5 % | 32.6 % | 34.1 % | 31.4 % | 28.9 % | 31.9 % | 34.2 % | 34.1 % |
EBIT-% (adj.) | 31.4 % | 31.1 % | 31.8 % | 29.5 % | 25.7 % | 29.2 % | 31.4 % | 31.8 % |
EBIT-% | 28.0 % | 28.0 % | 30.6 % | 27.3 % | 24.0 % | 28.4 % | 30.7 % | 31.3 % |
ROE | 19.9 % | 23.4 % | 25.7 % | 20.0 % | 17.7 % | 22.8 % | 25.2 % | 25.8 % |
ROI | 17.9 % | 22.1 % | 27.6 % | 23.3 % | 21.2 % | 27.2 % | 30.8 % | 31.7 % |
Valuation
2020 | 2021 | 2022 | 2023 | 2024e | 2025e | 2026e | 2027e | |
---|---|---|---|---|---|---|---|---|
Share price (EUR) | 50.30 | 55.55 | 38.60 | 25.20 | 27.00 | 27.00 | 27.00 | 27.00 |
Shares | 26.6 | 26.7 | 26.6 | 26.6 | 26.6 | 26.6 | 26.6 | 26.6 |
Market cap | 1,336.9 | 1,482.1 | 1,026.0 | 669.8 | 717.7 | 717.7 | 717.7 | 717.7 |
Enterprise value | 1,334.9 | 1,482.0 | 1,014.6 | 666.8 | 710.2 | 690.5 | 665.0 | 641.2 |
EV/S | 21.9 | 18.8 | 10.5 | 6.9 | 6.8 | 5.7 | 4.7 | 4.0 |
EV/EBITDA | 61.5 | 57.7 | 30.6 | 22.0 | 23.7 | 18.0 | 13.7 | 11.7 |
EV/EBIT (adj.) | 69.5 | 60.4 | 32.9 | 23.4 | 26.5 | 19.6 | 15.0 | 12.5 |
EV/EBIT | 78.1 | 67.1 | 34.2 | 25.3 | 28.5 | 20.2 | 15.3 | 12.7 |
P/E (adj.) | 86.6 | 75.1 | 44.6 | 31.5 | 35.4 | 26.0 | 20.5 | 17.6 |
P/E | 100.2 | 85.7 | 47.1 | 35.1 | 38.9 | 27.0 | 21.1 | 17.9 |
P/B | 19.2 | 18.9 | 11.3 | 6.7 | 6.6 | 5.7 | 5.0 | 4.3 |
P/S | 21.9 | 18.8 | 10.6 | 6.9 | 6.9 | 5.9 | 5.1 | 4.4 |
Dividend yield | 0.6 % | 0.6 % | 0.9 % | 1.5 % | 1.3 % | 2.0 % | 2.7 % | 3.4 % |
Equity ratio | 60.9 % | 63.0 % | 66.8 % | 72.7 % | 76.1 % | 78.4 % | 78.6 % | 78.2 % |
Gearing ratio | -2.7 % | -12.5 % | -2.9 % | -6.8 % | -21.6 % | -36.3 % | -46.0 % |
Quarter data
Q4/23 | 2023 | Q1/24 | Q2/24 | Q3/24 | Q4/24e | 2024e | Q1/25e | Q2/25e | |
---|---|---|---|---|---|---|---|---|---|
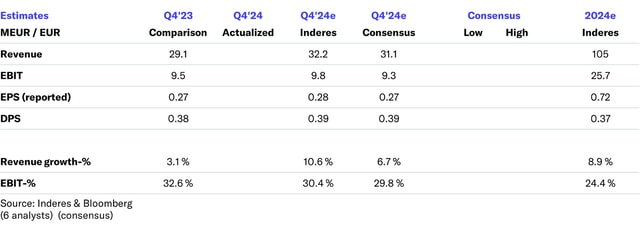
Revenue | 29.1 | 96.6 | 23.6 | 25.4 | 23.9 | 31.1 | 104.1 | 27.9 | 30.0 |
EBITDA | 10.5 | 30.3 | 6.2 | 7.1 | 6.7 | 10.1 | 30.0 | 8.2 | 9.0 |
EBIT | 9.5 | 26.3 | 5.1 | 5.3 | 5.5 | 9.1 | 25.0 | 7.1 | 8.0 |
Profit before taxes | 9.2 | 25.4 | 4.8 | 5.5 | 5.4 | 9.0 | 24.7 | 7.1 | 7.9 |
Net income | 7.1 | 19.1 | 3.6 | 4.1 | 3.8 | 6.9 | 18.5 | 5.4 | 6.1 |
ShowingAll content types
Revenio Interim Report Q3/2024
Revenio Group Corporation’s financial reporting and Annual General Meeting in 2025
Join Inderes community
Don't miss out - create an account and get all the possible benefits
Inderes account

Followings and notifications on followed companies
Analyst comments and recommendations
Stock comparison tool & other popular tools