Nightingale Health
2.03 EUR +0.5%4,309 investors are following this company
Nightingale Health operates in medical technology. The company specializes in the development of medical devices. The product portfolio is broad and includes platforms and services in blood tests that are used for disease prevention purposes. In addition to the main business, service and associated ancillary services are also offered. The business is run globally with the largest presence in Europe.
P/E (24e)
-7.55
EV/EBIT (adj.) (24e)
-3.25
P/B (24e)
1.53
Dividend yield-% (24e)
-
Target price
1.60 EUR
Recommendation
Reduce
Updated
10.5.2024
First North Finland
HEALTH
Daily low / high price
2 / 2.08
EUR
Market cap
123.66M EUR
Turnover
88.71K EUR
Volume
43K
Business risk
Valuation risk
Current
Previous
Latest research
Extensive report
Inderes' extensive report is an investor's handbook on customer companies covered by our research.
The latest extensive report was released
Read the reportAnalyst
Antti Luiro
Head of Nordic ER Development, Analyst
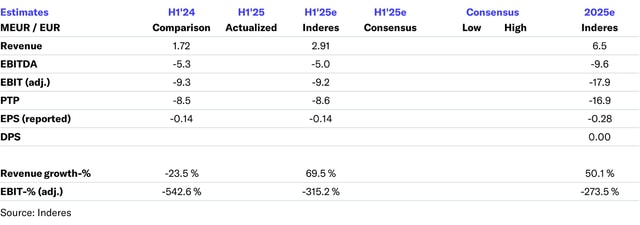
Latest videos
Financial calendar
Annual report
2024-09-20
General meeting
2024-11-08
Interim report
2025-03-06
Major OwnersSource: Millistream Market Data AB
Owner | Capital | Votes |
---|---|---|
Cor Group Oy | 10.2 % | 12.7 % |
Antti Kangas | 8.8 % | 21.8 % |
Premium
This content is for our Premium customers only.
Insider Transactions
Insider | Date | Total value |
---|---|---|
Ilkka Laurila | 2023-10-12 | 8,831EUR |
Tuukka Paavola | 2023-09-29 | 7,730EUR |
Premium
This content is for our Premium customers only.
Income statement
2020 | 2021 | 2022 | 2023 | 2024e | 2025e | 2026e | 2027e | |
---|---|---|---|---|---|---|---|---|
Revenue | 1.8 | 2.3 | 2.3 | 4.2 | 4.7 | 8.7 | 15.1 | 24.9 |
growth-% | -13.0 % | 29.4 % | 0.3 % | 80.8 % | 12.8 % | 85.0 % | 72.7 % | 65.0 % |
EBITDA | -3.1 | -7.3 | -9.4 | -12.9 | -9.8 | -9.6 | -6.4 | -0.7 |
EBIT (adj.) | -3.3 | -8.6 | -13.6 | -18.5 | -17.8 | -17.6 | -13.1 | -6.7 |
EBIT | -3.3 | -9.8 | -13.6 | -18.5 | -17.8 | -17.6 | -13.1 | -6.7 |
Profit before taxes | -3.7 | -9.7 | -16.2 | -18.2 | -16.3 | -16.7 | -12.4 | -6.3 |
Net income | -3.7 | -9.7 | -16.1 | -18.2 | -16.4 | -16.7 | -11.8 | -5.9 |
EPS (adj.) | -0.21 | -0.23 | -0.30 | -0.27 | -0.27 | -0.19 | -0.10 | |
growth-% | ||||||||
Dividend | 0.00 | 0.00 | 0.00 | 0.00 | 0.00 | 0.00 | 0.00 | 0.00 |
Dividend ratio |
Profitability and return on capital
2020 | 2021 | 2022 | 2023 | 2024e | 2025e | 2026e | 2027e | |
---|---|---|---|---|---|---|---|---|
EBITDA-% | -174.9 % | -316.7 % | -405.9 % | -308.4 % | -208.5 % | -110.2 % | -42.6 % | -2.8 % |
EBIT-% (adj.) | -187.6 % | -375.0 % | -589.5 % | -442.9 % | -377.5 % | -201.9 % | -87.0 % | -26.9 % |
EBIT-% | -187.6 % | -423.2 % | -589.5 % | -442.9 % | -377.5 % | -201.9 % | -87.0 % | -26.9 % |
ROE | -62.3 % | -15.0 % | -13.7 % | -17.4 % | -18.4 % | -23.0 % | -20.3 % | -12.0 % |
ROI | -26.1 % | -13.7 % | -11.1 % | -17.1 % | -19.4 % | -23.1 % | -20.8 % | -12.3 % |
Valuation
2020 | 2021 | 2022 | 2023 | 2024e | 2025e | 2026e | 2027e | |
---|---|---|---|---|---|---|---|---|
Share price (EUR) | 3.68 | 1.02 | 1.12 | 2.03 | 2.03 | 2.03 | 2.03 | |
Shares | 60.5 | 60.9 | 60.9 | 60.9 | 60.9 | 60.9 | 60.9 | |
Market cap | 222.5 | 61.9 | 68.0 | 123.7 | 123.7 | 123.7 | 123.7 | |
Enterprise value | 114.6 | -28.9 | -10.0 | 57.8 | 71.5 | 84.1 | 90.2 | |
EV/S | - | 49.7 | - | - | 12.3 | 8.2 | 5.6 | 3.6 |
EV/EBITDA | - | - | 3.1 | 0.8 | - | - | - | - |
EV/EBIT (adj.) | - | - | 2.1 | 0.5 | - | - | - | - |
EV/EBIT | - | - | 2.1 | 0.5 | - | - | - | - |
P/E (adj.) | - | - | - | - | - | - | - | - |
P/E | - | - | - | - | - | - | - | - |
P/B | - | 1.8 | 0.6 | 0.7 | 1.5 | 1.9 | 2.4 | 2.7 |
P/S | - | 96.5 | 26.8 | 16.3 | 26.2 | 14.2 | 8.2 | 5.0 |
Dividend yield | ||||||||
Equity ratio | 23.2 % | 88.5 % | 89.8 % | 91.2 % | 88.7 % | 84.0 % | 78.6 % | 71.7 % |
Gearing ratio | 87.6 % | -87.4 % | -81.3 % | -80.1 % | -81.3 % | -81.2 % | -75.4 % | -71.8 % |
Quarter data
Q3/23 | Q4/23 | 2023 | Q1/24 | Q2/24 | Q3/24e | Q4/24e | 2024e | Q1/25e | |
---|---|---|---|---|---|---|---|---|---|
Revenue | 1.9 | 4.2 | 1.7 | 3.0 | 4.7 | ||||
EBITDA | -7.4 | -12.9 | -5.3 | -4.5 | -9.8 | ||||
EBIT | -9.9 | -18.5 | -9.3 | -8.5 | -17.8 | ||||
Profit before taxes | -9.7 | -18.2 | -8.5 | -7.8 | -16.3 | ||||
Net income | -9.7 | -18.2 | -8.5 | -7.8 | -16.4 |
ShowingAll content types
Inside Information: 23andMe and Nightingale Health Announce Strategic Collaboration to Pilot Blood Biomarker Panel
Nightingale enters into a new strategic partnership in the US
Join Inderes community
Don't miss out - create an account and get all the possible benefits
Inderes account
Followings and notifications on followed companies
Analyst comments and recommendations
Stock comparison tool & other popular tools