Nexstim
7.92
EUR
-0.25 %
5,436 following
NXTMH
First North Finland
Medical Equipment & Services
Health Care
Overview
Financials & Estimates
Investor consensus
-0.25%
-5.04%
-14.1%
+0.25%
+61.63%
+258.37%
+48.87%
+758.35%
-98.69%
Nexstim operates in medical technology. The company has developed a non-invasive brain stimulation technology called SmartFocus®. It is a navigated transcranial magnetic stimulation (nTMS) technology with 3D navigation providing targeting of the TMS to the specific area of the brain. The technology is aimed for the treatment of major depression and chronic neuropathic pain. The company was founded in 2000 and has its headquarters in Helsinki.
Read moreMarket cap
56.89M EUR
Turnover
7.34K EUR
P/E (adj.) (25e)
16.54
EV/EBIT (adj.) (25e)
17.7
P/B (25e)
10.52
EV/S (25e)
3.84
Dividend yield-% (25e)
-
Coverage

Analyst
Revenue and EBIT-%
Revenue M
EBIT-% (adj.)
EPS and dividend
EPS (adj.)
Dividend %
Financial calendar
15/8
2025
Interim report Q2'25
Risk
Business risk
Valuation risk
Low
High
All
Research
Press releases
ShowingAll content types
Nexstim Plc: Share subscriptions based on stock options 2018 and 2020
Nexstim Receives System Order from US University
Join Inderes community
Don't miss out - create an account and get all the possible benefits
Inderes account
Followings and notifications on followed companies
Analyst comments and recommendations
Stock comparison tool & other popular tools
Nexstim Plc: Resolutions of the Annual General Meeting of Shareholders
Nexstim Plc: Managers’ Transactions, Karvinen
Nexstim Plc: Invitation to the Annual General Meeting
Nexstim Plc Publishes 2024 Annual Report
Nexstim: Returning to the buy side after a share price decline
Nexstim Plc: Managers’ Transactions, Weckroth
Nexstim Plc: Managers’ Transactions, Weckroth
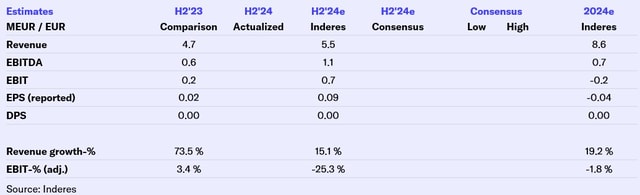
Nexstim H2'24: Solid growth in line with expectations
NEXSTIM PLC’S FINANCIAL STATEMENTS BULLETIN 2024