Netum Group
2.3
EUR
+0.88 %
1,712 following
NETUM
First North Finland
IT Services
Technology
Overview
Financials & Estimates
Investor consensus
+0.88%
-4.96%
-10.16%
-8%
-19.58%
-12.55%
-45.88%
-
-48.31%
Netum operates in the IT sector. The company specializes in the development of software solutions. The software is self-developed and is mainly used for the design and implementation of software, management and monitoring of information systems, cyber security solutions, and for IT management. The customers consist of corporate customers operating in a number of sectors. In addition to the main business, various value-added services are offered. The largest operations are in the Nordic region.
Read moreMarket cap
29.41M EUR
Turnover
2.44K EUR
P/E (adj.) (25e)
15.84
EV/EBIT (adj.) (25e)
9.15
EV/S (25e)
0.78
Dividend yield-% (25e)
5.22 %

Revenue and EBIT-%
Revenue M
EBIT-% (adj.)
EPS and dividend
EPS (adj.)
Dividend %
Financial calendar
29/4
2025
Business review Q1'25
19/8
2025
Interim report Q2'25
4/11
2025
Business review Q3'25
Risk
Business risk
Valuation risk
Low
High
All
Research
Press releases
3rd party
ShowingAll content types
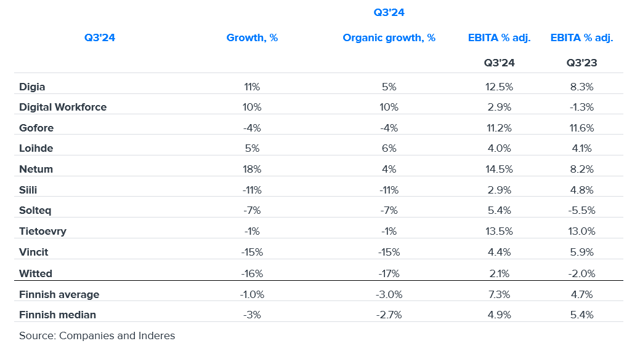
Outlook for the IT service sector 2025: Growth will kick off again at the end of the year
Resolutions of Netum Group Plc's Annual General Meeting and the constitutive meeting of the Board of Directors
Join Inderes community
Don't miss out - create an account and get all the possible benefits
Inderes account
Followings and notifications on followed companies
Analyst comments and recommendations
Stock comparison tool & other popular tools
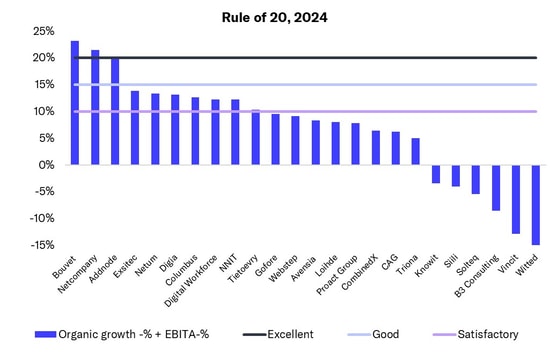
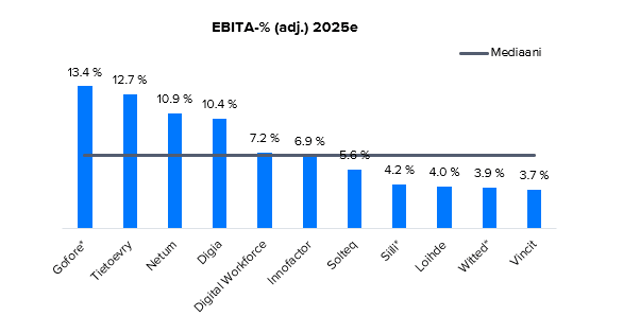
In the IT service sector, a few Nordic companies achieved excellent performance measured by the 'Rule of 20'
IT service sector: Q4 was tough, as was 2024
Netum Group Plc: The CEO of the subsidiary Studyo Oy stepping down
Netum Group Plc: Managers’ transactions – Köngäs
Notice to Netum Group Plc's Annual General Meeting 2025
Netum Group Plc’s Annual report 2024 published
Netum Group Plc’s financial statements release 2024: Significant growth and profitability improvement in 2024 – Q4 at the same level as comparison period
Netum will publish its financial statements release 2024 on Tuesday 25 February 2025
Transfer of Netum Group Plc's own shares for the payment of reward shares of the personnel offering – Change in the number of treasury shares held by the company
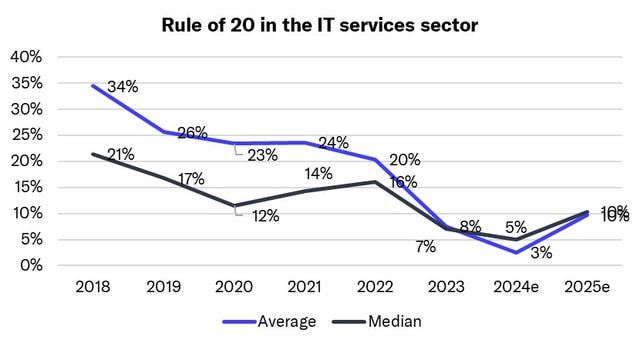
Introducing the Rule of 20: The best measure for IT services performance signals market softening
Change in Netum Group Plc's Board of Directors and Management Team – new CEO Repe Harmanen to start in his position on 10 January 2025
Netum Group Plc: Managers’ transactions – Köngäs
Netum Group Plc: Inside information, profit warning: Netum lowers its revenue guidance for 2024 and specifies its guidance on comparable EBITA
IT service sector: Bottom of cycle passed, grain will be separated from chaff in 2025