Solwers
2.25
EUR
+2.27 %
1,461 following
SOLWERS
First North Finland
Industrial Goods & Services
Industrials
Overview
Financials & Estimates
Investor consensus
+2.27%
-6.25%
-26.47%
-30.12%
-35.71%
-38.19%
-66.42%
-
-73.05%
Solwers is a consulting company focused on the industrial sector. The company specializes in digital solutions that concern planning and project management services. Examples of the company's services include architecture, technical consulting, environmental monitoring, project management, circular economy, and digital solutions. The customers are found in a number of industries and mainly among small and medium-sized corporate customers. Solwers operates worldwide with the largest presence in the Nordic region.
Read moreMarket cap
22.88M EUR
Turnover
18.47K EUR
P/E (adj.) (25e)
13.42
EV/EBIT (adj.) (25e)
14.02
P/B (25e)
0.54
EV/S (25e)
0.56
Dividend yield-% (25e)
1.78 %
Coverage

Co. Head of Research
Revenue and EBIT-%
Revenue M
EBIT-% (adj.)
EPS and dividend
EPS (adj.)
Dividend %
Financial calendar
28/5
2025
Business review Q1'25
26/8
2025
Interim report Q2'25
21/11
2025
Business review Q3'25
Risk
Business risk
Valuation risk
Low
High
All
Research
Webcasts
Press releases
3rd party
ShowingAll content types
Solwers Oyj: Notice convening the Annual General Meeting of Solwers Plc
Solwers Oyj: Solwers Plc's Financial Reports and Remuneration Report for the Year 2024 Published
Join Inderes community
Don't miss out - create an account and get all the possible benefits
Inderes account
Followings and notifications on followed companies
Analyst comments and recommendations
Stock comparison tool & other popular tools
Solwers' CEO will change by next spring
Solwers Oyj: Inside information: Solwers' CEO to change by spring 2026
Solwers Oyj: Proposals of Solwers Plc's Shareholders' Nomination Committee for the Annual General Meeting 2025
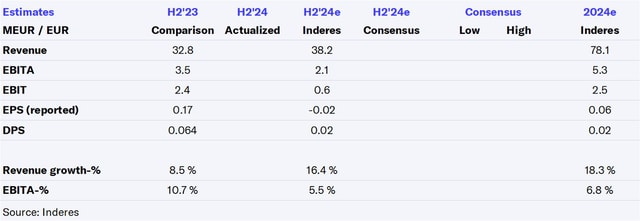
Solwers H2'24: Increased investment activity is key

Solwers H2’24: “Jag ser positivt på framtiden”
Solwers, Webcast, Q4'24
Solwers Oyj: Financial Statements Release 1 January - 31 December, 2024
Solwers Q4'24 preview: With the profit warning, the overall picture of the result is clear
Kreate has filed a compensation claim against Solwers' subsidiary
Solwers Oyj: Inside Information: Solwers Plc's subsidiary Finnmap Infra Oy has received a compensation claim filed by Kreate Oy
Solwers Oyj: Publication of Solwers' Financial Statements 2024 Release and invitation to webcast
Solwers: Challenges have surfaced late in the year
Solwers Oyj: Inside Information: Solwers' IFRS EBIT at the end of 2024 lower than anticipated
Solwers Oyj: Solwers Plc's Financial Calendar and Annual General Meeting 2025
Solwers as an Investment | Company Night Dec. 16, 2024