Taaleri
7.28
EUR
+0.97 %
8,884 following
TAALA
NASDAQ Helsinki
Financial Services
Financials
Overview
Financials & Estimates
Investor consensus
+0.97%
-5.82%
-8.31%
-9.34%
-10.46%
-29.46%
-36.59%
+15.56%
+142.67%
Taaleri operates in the financial sector. The company is a Nordic private equity fund company that focuses on renewable energy and other alternative investments. The company has two business segments: Equity Funds and Strategic Investments. With its capital funds, Taaleri creates, for example, wind and solar power, biofuels and real estate. The company was founded in 2007 and its head office is located in Helsinki, Finland.
Read moreMarket cap
205.27M EUR
Turnover
147.52K EUR
P/E (adj.) (25e)
10.56
EV/EBIT (adj.) (25e)
6.01
P/B (25e)
0.96
EV/S (25e)
2.75
Dividend yield-% (25e)
5.68 %
Revenue and EBIT-%
Revenue M
EBIT-% (adj.)
EPS and dividend
EPS (adj.)
Dividend %
Financial calendar
29/4
2025
Interim report Q1'25
13/8
2025
Interim report Q2'25
2/10
2025
Half year dividend
Risk
Business risk
Valuation risk
Low
High
All
Research
Webcasts
Press releases
3rd party
ShowingAll content types
Garantia guaranteed Multi-Issuer Bond series continues with fifth issue, sized at EUR 62.5 million
Taaleri changes its financial reporting and publishes comparable income statement, balance sheet and segment information for 2024
Join Inderes community
Don't miss out - create an account and get all the possible benefits
Inderes account
Followings and notifications on followed companies
Analyst comments and recommendations
Stock comparison tool & other popular tools
Taaleri establishes a new share-based incentive plan for the CEO
Decisions of the organisational meeting of Taaleri Plc’s Board of Directors
Decisions of Taaleri Plc's Annual General Meeting 2025

Taaleri Interim Statement for the period January–March 2025
Taaleri Plc’s Annual Report 2024 has been published
Impact of real estate fund issues on various Finnish asset managers
Notice to the Annual General Meeting of Taaleri Plc
Taaleri Plc – Managers’ transactions – Leif Frilund
Taaleri Plc – Managers’ transactions – Titta Elomaa

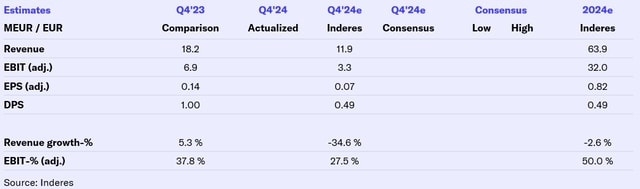
Taaleri Q4'24: Share remains firmly in the discount basket
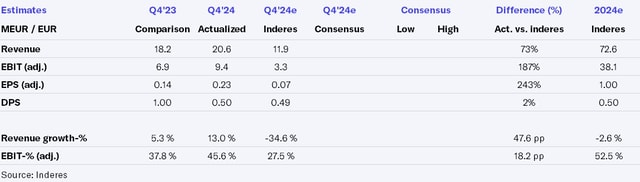
Taaleri Q4'24 flash comment: Big earnings beat on non-recurring fees and outlook is clear

Taaleri Financial Statements Bulletin 2024
Changes in Taaleri’s management – Lauri Lipsanen appointed as CFO and member of the Executive Management Team
Taaleri Plc Interim Statement 1.1.–31.12.2024: Taaleri’s positive financial performance continued in the final quarter of the year