Björn Borg
51.11
SEK
+0.22 %
BORG
NASDAQ Stockholm
Personal Goods
Consumer Goods & Services
59 following
+0.22%
-10.18%
-15.25%
-14.66%
+20.96%
+29.69%
+32%
+185.81%
+2,850.55%
corporate.bjornborg.com/en
Björn Borg is active in the retail industry. The company is a manufacturer and retailer of clothing, shoes, bags, glasses, and other accessories, with a focus on the sports segment. The Group has its own operations at all stages from brand development to consumer sales and sales take place via concept stores, licensed retailers. as well as via E-commerce. The largest market is in the Nordic region. The head office is located in Stockholm.
P/E (adj.) (24e)
16.79
EV/EBIT (adj.) (24e)
12.91
P/B (24e)
3.59
Dividend yield-% (24e)
5.87 %
Target price
67.00 SEK
Recommendation
Accumulate
Updated
18.11.2024
NASDAQ Stockholm
BORG
Daily low / high price
51.11 / 51.99
SEK
Market cap
1.29B SEK
Turnover
1.16M SEK
Volume
22K
Business risk
Valuation risk
Current
Previous
Latest research
Extensive report
Inderes' extensive report is an investor's handbook on customer companies covered by our research.
The latest extensive report was released
Read the reportAnalyst
Lucas Mattsson
Analyst
Latest videos
Financial calendar
Annual report
2025-02-21
General meeting
2025-05-15
Interim report
2025-05-15
Major OwnersSource: Millistream Market Data AB
Owner | Capital | Votes |
---|---|---|
Nordnet Pension | 14.3 % | 14.3 % |
Martin Bjäringer | 9.9 % | 9.9 % |
Mats H Nilsson | 6.5 % | 6.5 % |
Thomas Eklund | 5.6 % | 5.6 % |
Vilhelm Schottenius w family | 5.6 % | 5.6 % |
Lazard Frères Banque | 5.2 % | 5.2 % |
Avanza Pension | 4.6 % | 4.6 % |
Fredrik Lövstedt genom bolag | 3.8 % | 3.8 % |
Jofam AB | 2.0 % | 2.0 % |
Carl Rosvall | 1.9 % | 1.9 % |
Forum updates
Income statement
2020 | 2021 | 2022 | 2023 | 2024e | 2025e | 2026e | 2027e | |
---|---|---|---|---|---|---|---|---|
Revenue | 705.2 | 768.2 | 835.2 | 872.3 | 971.3 | 1,053.9 | 1,138.1 | 1,218.8 |
growth-% | -6.8 % | 8.9 % | 8.7 % | 4.4 % | 11.4 % | 8.5 % | 8.0 % | 7.1 % |
EBITDA | 74.5 | 139.6 | 107.7 | 133.6 | 137.8 | 151.9 | 164.2 | 175.2 |
EBIT (adj.) | 33.7 | 104.1 | 93.9 | 100.6 | 105.2 | 119.9 | 134.4 | 146.8 |
EBIT | 33.7 | 104.1 | 72.9 | 100.6 | 105.2 | 119.9 | 134.4 | 146.8 |
Profit before taxes | 17.6 | 106.9 | 70.4 | 97.7 | 98.1 | 117.8 | 131.0 | 145.5 |
Net income | 18.8 | 86.0 | 50.9 | 76.0 | 76.6 | 91.9 | 104.0 | 115.6 |
EPS (adj.) | 0.75 | 3.42 | 2.86 | 3.02 | 3.04 | 3.65 | 4.14 | 4.60 |
growth-% | -51.6 % | 356.8 % | -16.5 % | 5.7 % | 0.8 % | 20.0 % | 13.2 % | 11.1 % |
Dividend | 1.50 | 2.50 | 2.00 | 3.00 | 3.00 | 3.40 | 3.72 | 4.14 |
Dividend ratio | 200.3 % | 73.1 % | 98.9 % | 99.3 % | 98.5 % | 93.1 % | 90.0 % | 90.0 % |
Profitability and return on capital
2020 | 2021 | 2022 | 2023 | 2024e | 2025e | 2026e | 2027e | |
---|---|---|---|---|---|---|---|---|
EBITDA-% | 10.6 % | 18.2 % | 12.9 % | 15.3 % | 14.2 % | 14.4 % | 14.4 % | 14.4 % |
EBIT-% (adj.) | 4.8 % | 13.5 % | 11.2 % | 11.5 % | 10.8 % | 11.4 % | 11.8 % | 12.0 % |
EBIT-% | 4.8 % | 13.5 % | 8.7 % | 11.5 % | 10.8 % | 11.4 % | 11.8 % | 12.0 % |
ROE | 6.6 % | 27.0 % | 15.2 % | 22.1 % | 21.4 % | 25.1 % | 27.1 % | 28.6 % |
ROI | 6.7 % | 22.7 % | 16.6 % | 25.1 % | 25.4 % | 26.5 % | 28.3 % | 30.0 % |
Valuation
2020 | 2021 | 2022 | 2023 | 2024e | 2025e | 2026e | 2027e | |
---|---|---|---|---|---|---|---|---|
Share price (SEK) | 19.78 | 50.00 | 31.60 | 45.40 | 51.11 | 51.11 | 51.11 | 51.11 |
Shares | 25.1 | 25.1 | 25.1 | 25.1 | 25.1 | 25.1 | 25.1 | 25.1 |
Market cap | 497.4 | 1,257.4 | 794.7 | 1,141.7 | 1,285.3 | 1,285.3 | 1,285.3 | 1,285.3 |
Enterprise value | 583.3 | 1,296.6 | 860.3 | 1,157.9 | 1,358.8 | 1,353.7 | 1,346.4 | 1,336.2 |
EV/S | 0.8 | 1.7 | 1.0 | 1.3 | 1.4 | 1.3 | 1.2 | 1.1 |
EV/EBITDA | 7.8 | 9.3 | 8.0 | 8.7 | 9.9 | 8.9 | 8.2 | 7.6 |
EV/EBIT (adj.) | 17.3 | 12.5 | 9.2 | 11.5 | 12.9 | 11.3 | 10.0 | 9.1 |
EV/EBIT | 17.3 | 12.5 | 11.8 | 11.5 | 12.9 | 11.3 | 10.0 | 9.1 |
P/E (adj.) | 26.4 | 14.6 | 11.1 | 15.0 | 16.8 | 14.0 | 12.4 | 11.1 |
P/E | 26.4 | 14.6 | 15.6 | 15.0 | 16.8 | 14.0 | 12.4 | 11.1 |
P/B | 1.7 | 3.7 | 2.4 | 3.2 | 3.6 | 3.4 | 3.3 | 3.1 |
P/S | 0.7 | 1.6 | 1.0 | 1.3 | 1.3 | 1.2 | 1.1 | 1.1 |
Dividend yield | 7.6 % | 5.0 % | 6.3 % | 6.6 % | 5.9 % | 6.7 % | 7.3 % | 8.1 % |
Equity ratio | 47.0 % | 49.1 % | 49.7 % | 55.6 % | 53.0 % | 52.1 % | 52.8 % | 54.0 % |
Gearing ratio | 29.5 % | 11.7 % | 20.2 % | 4.6 % | 20.9 % | 18.6 % | 15.8 % | 12.4 % |
Quarter data
Q4/23 | 2023 | Q1/24 | Q2/24 | Q3/24 | Q4/24e | 2024e | Q1/25e | Q2/25e | |
---|---|---|---|---|---|---|---|---|---|
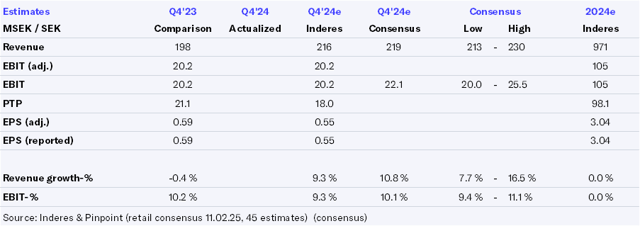
Revenue | 197.6 | 872.3 | 256.8 | 213.2 | 285.4 | 216.0 | 971.3 | 277.0 | 232.2 |
EBITDA | 28.3 | 133.6 | 41.6 | 17.6 | 50.2 | 28.4 | 137.8 | 45.3 | 19.8 |
EBIT | 20.2 | 100.6 | 33.5 | 9.5 | 42.0 | 20.2 | 105.2 | 37.3 | 11.8 |
Profit before taxes | 21.1 | 97.7 | 27.0 | 9.1 | 44.1 | 18.0 | 98.1 | 36.8 | 11.3 |
Net income | 15.0 | 76.0 | 21.2 | 6.5 | 35.0 | 13.9 | 76.6 | 28.7 | 8.8 |
ShowingAll content types
Analytikerintervju: NIBE, Metacon & Björn Borg!
Analyst Group: Equity Research Report on Björn Borg - Solid Growth Across Key Focus Areas
Join Inderes community
Don't miss out - create an account and get all the possible benefits
Inderes account
Followings and notifications on followed companies
Analyst comments and recommendations
Stock comparison tool & other popular tools