Purmo Group
11.25
EUR
-1.32 %
PURMO
NASDAQ Helsinki
Industrial Goods & Services
Industrials
1,549 following
-1.32%
+0.45%
+0.9%
+7.14%
+67.91%
+73.61%
-5.46%
-
+12.05%
investors.purmogroup.com
Purmo Group develops solutions for indoor climate. The company provides heating and cooling solutions for residential buildings and premises, including radiators, towel warmers, underfloor heating, convectors, valves, and controls. The business is divided into a number of business areas and the solutions are used in industry and the real estate industry. Customers are found on a global level with the largest concentration in Europe. The products are aimed at corporate and private customers.
P/E (adj.) (24e)
19.15
EV/EBIT (adj.) (24e)
11.9
P/B (24e)
1.12
Dividend yield-% (24e)
-
Target price
10.97 EUR
Recommendation
Reduce
Updated
23.10.2024
NASDAQ Helsinki
PURMO
Daily low / high price
11.25 / 11.4
EUR
Market cap
480.13M EUR
Turnover
3.47K EUR
Volume
307
Business risk
Valuation risk
Current
Previous
Latest research
Extensive report
Inderes' extensive report is an investor's handbook on customer companies covered by our research.
The latest extensive report was released
Read the reportAnalyst
Rauli Juva
Analyst
Latest videos
Financial calendar
Quarterly dividend
2025-01-16
Income statement
2020 | 2021 | 2022 | 2023 | 2024e | 2025e | 2026e | 2027e | |
---|---|---|---|---|---|---|---|---|
Revenue | 671.2 | 843.6 | 904.1 | 743.2 | 720.7 | 768.3 | 790.5 | 813.6 |
growth-% | -3.7 % | 25.7 % | 7.2 % | -17.8 % | -3.0 % | 6.6 % | 2.9 % | 2.9 % |
EBITDA | 71.9 | 33.6 | 78.4 | 46.6 | 74.3 | 94.5 | 108.4 | 109.9 |
EBIT (adj.) | 55.2 | 73.7 | 60.7 | 55.4 | 63.1 | 74.5 | 77.9 | 79.0 |
EBIT | 42.0 | 3.5 | 39.0 | 9.7 | 44.8 | 64.5 | 77.9 | 79.0 |
Profit before taxes | 31.9 | -5.1 | 21.6 | -9.6 | 19.9 | 48.5 | 61.4 | 63.4 |
Net income | 24.9 | -18.8 | 13.2 | -9.3 | 11.6 | 37.4 | 47.3 | 48.8 |
EPS (adj.) | 0.94 | 1.78 | 0.85 | 0.68 | 0.59 | 1.00 | 1.09 | 1.15 |
growth-% | 52.7 % | 90.8 % | -52.5 % | -19.5 % | -13.9 % | 69.9 % | 9.3 % | 5.0 % |
Dividend | 0.00 | 0.36 | 0.35 | 0.35 | 0.00 | 0.00 | 0.00 | 0.00 |
Dividend ratio | -77.8 % | 112.9 % | -160.3 % |
Profitability and return on capital
2020 | 2021 | 2022 | 2023 | 2024e | 2025e | 2026e | 2027e | |
---|---|---|---|---|---|---|---|---|
EBITDA-% | 10.7 % | 4.0 % | 8.7 % | 6.3 % | 10.3 % | 12.3 % | 13.7 % | 13.5 % |
EBIT-% (adj.) | 8.2 % | 8.7 % | 6.7 % | 7.5 % | 8.8 % | 9.7 % | 9.9 % | 9.7 % |
EBIT-% | 6.3 % | 0.4 % | 4.3 % | 1.3 % | 6.2 % | 8.4 % | 9.9 % | 9.7 % |
ROE | 4.8 % | -4.2 % | 3.3 % | -2.2 % | 2.7 % | 8.4 % | 10.4 % | 10.3 % |
ROI | 6.2 % | 0.5 % | 5.1 % | 1.3 % | 6.0 % | 8.8 % | 10.7 % | 10.8 % |
Valuation
2020 | 2021 | 2022 | 2023 | 2024e | 2025e | 2026e | 2027e | |
---|---|---|---|---|---|---|---|---|
Share price (EUR) | 14.20 | 8.22 | 6.18 | 11.25 | 11.25 | 11.25 | 11.25 | |
Shares | 40.7 | 40.7 | 42.7 | 42.7 | 42.7 | 42.7 | 42.6 | 42.6 |
Market cap | 577.5 | 350.7 | 263.6 | 479.9 | 479.9 | 479.3 | 479.3 | |
Enterprise value | 816.9 | 627.5 | 538.5 | 750.8 | 723.5 | 680.2 | 635.1 | |
EV/S | - | 1.0 | 0.7 | 0.7 | 1.0 | 0.9 | 0.9 | 0.8 |
EV/EBITDA | - | 24.3 | 8.0 | 11.6 | 10.1 | 7.7 | 6.3 | 5.8 |
EV/EBIT (adj.) | - | 11.1 | 10.3 | 9.7 | 11.9 | 9.7 | 8.7 | 8.0 |
EV/EBIT | - | 236.1 | 16.1 | 55.5 | 16.8 | 11.2 | 8.7 | 8.0 |
P/E (adj.) | - | 8.0 | 9.7 | 9.1 | 19.2 | 11.3 | 10.3 | 9.8 |
P/E | - | - | 25.7 | - | 71.0 | 14.7 | 10.3 | 9.8 |
P/B | - | 1.5 | 0.9 | 0.6 | 1.1 | 1.0 | 1.1 | 1.0 |
P/S | - | 0.7 | 0.4 | 0.4 | 0.7 | 0.6 | 0.6 | 0.6 |
Dividend yield | 2.5 % | 4.3 % | 5.7 % | |||||
Equity ratio | 61.9 % | 37.3 % | 41.0 % | 43.7 % | 45.0 % | 46.4 % | 46.8 % | 49.2 % |
Gearing ratio | 14.5 % | 61.3 % | 68.6 % | 49.5 % | 49.2 % | 39.8 % | 44.9 % | 31.4 % |
Quarter data
Q4/23 | 2023 | Q1/24 | Q2/24 | Q3/24 | Q4/24e | 2024e | Q1/25e | Q2/25e | |
---|---|---|---|---|---|---|---|---|---|
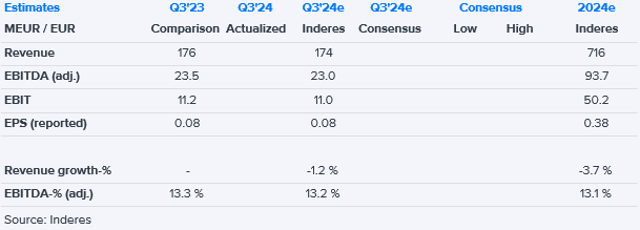
Revenue | 175.0 | 743.2 | 188.0 | 171.9 | 172.8 | 188.0 | 720.7 | ||
EBITDA | -10.7 | 46.6 | 25.3 | 13.0 | 13.0 | 23.0 | 74.3 | ||
EBIT | -25.5 | 9.7 | 17.9 | 5.8 | 5.4 | 15.7 | 44.8 | ||
Profit before taxes | -30.4 | -9.6 | 12.4 | 0.9 | -4.1 | 10.7 | 19.9 | ||
Net income | -23.4 | -9.3 | 8.2 | -2.0 | -6.3 | 6.8 | 11.6 |
ShowingAll content types
Purmo Group Plc – Managers' transactions – Rettig Oy Ab
Purmo Q3'24: Already on the way out of the stock market
Join Inderes community
Don't miss out - create an account and get all the possible benefits
Inderes account
Followings and notifications on followed companies
Analyst comments and recommendations
Stock comparison tool & other popular tools