Metacon
0.129
SEK
+6.1 %
Less than 1K followers
META
First North Stockholm
Industrial Goods & Services
Industrials
Overview
Financials & Estimates
Ownership
Investor consensus
+6.1%
+13.78%
+2.55%
-3.01%
-48.99%
-8.65%
-94.41%
-84.49%
-44.24%
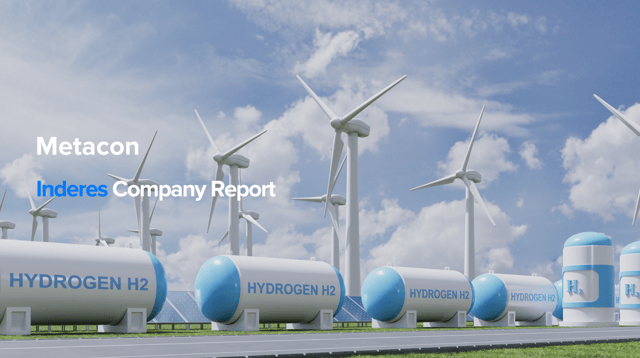
Metacon is an energy technology company that develops and sells small and large energy systems for the production of hydrogen, electricity and heat. The company was founded in 2011 and has patented technology for the production of hydrogen gas from biogas or other hydrocarbons. The range consists, for example, of gas stations and larger CHP systems. The company has its headquarters in Örebro.
Read moreMarket cap
175.63M SEK
Turnover
575.76K SEK
P/E (adj.) (25e)
-2.62
EV/EBIT (adj.) (25e)
-3.26
P/B (25e)
2.57
EV/S (25e)
0.58
Dividend yield-% (25e)
-
Coverage

Analyst
Revenue and EBIT-%
Revenue M
EBIT-% (adj.)
EPS and dividend
EPS (adj.)
Dividend %
Financial calendar
21/5
2025
Interim report Q1'25
27/5
2025
General meeting '25
21/8
2025
Interim report Q2'25
Risk
Business risk
Valuation risk
Low
High
All
Research
Press releases
3rd party
ShowingAll content types
Metacon AB: Metacon announces outcome in the exercise of warrants of series TO1 and resolves on directed issues to underwriters
Metacon AB: Metacon offentliggör utfall i utnyttjandet av teckningsoptioner av serie TO1 och beslutar om riktade emissioner till garanter
Join Inderes community
Don't miss out - create an account and get all the possible benefits
Inderes account
Followings and notifications on followed companies
Analyst comments and recommendations
Stock comparison tool & other popular tools
Metacon AB: Metacon slutför kontraktet för 50 MW vätgasprojekt med Motor Oil Hellas genom att sluta avtal om ytterligare 20 MW kapacitet
Metacon AB: Metacon completes the 50 MW hydrogen project contract with Motor Oil Hellas by closing agreement for additional 20 MW capacity
Metacon in final negotiations with a new customer
Metacon AB: Metacon informs about ongoing business negotiations
Metacon AB: Metacon informerar om pågående affärsförhandling
Metacon AB: The last day of trading with the warrants of series TO1
Metacon AB: Sista dag för handel med teckningsoptionerna av serie TO1
Metacon AB: Metacon har via Pherousa erhållit initialt Approval in Principle från ABS och DNV för ammonia cracking
Metacon AB: Metacon via Pherousa receives initial Approval in Principle from ABS and DNV for Ammonia Cracking
Metacon AB: Rättelse av teckningskurs för teckningsoptioner av serie TO1
Metacon AB: Correction of exercise price for warrants of series TO1