Investors House
5.3
EUR
+1.15 %
INVEST
NASDAQ Helsinki
Real Estate Management & Development
Real Estate
4,101 following
www.investorshouse.fi
Investors House operates in the real estate industry. The investments are mainly found among larger commercial properties around the Finnish market, with a focus on growing university cities. In addition to direct ownership and management, the properties are also leased out to various tenants. Investors House operates in Finnish market and the headquarters is located in Helsinki.
P/E (adj.) (24e)
4.32
EV/EBIT (adj.) (24e)
5.89
P/B (24e)
0.86
Dividend yield-% (24e)
6.6 %
Target price
5.70 EUR
Recommendation
Accumulate
Updated
12.11.2024
NASDAQ Helsinki
INVEST
Daily low / high price
5.24 / 5.3
EUR
Market cap
33.86M EUR
Turnover
1.87K EUR
Volume
356
Business risk
Valuation risk
Current
Previous
Income statement
2020 | 2021 | 2022 | 2023 | 2024e | 2025e | 2026e | 2027e | |
---|---|---|---|---|---|---|---|---|
Revenue | 9.5 | 9.8 | 7.6 | 6.9 | 10.0 | 11.1 | 11.4 | 11.7 |
growth-% | -17.4 % | 3.2 % | -22.1 % | -9.8 % | 46.2 % | 10.5 % | 2.6 % | 2.5 % |
EBITDA | -1.0 | -0.5 | 4.3 | 3.9 | 10.9 | 5.2 | 5.4 | 5.5 |
EBIT (adj.) | -1.0 | -0.5 | 4.3 | 3.9 | 10.9 | 5.2 | 5.4 | 5.5 |
EBIT | -1.0 | -0.5 | 4.3 | 3.9 | 10.9 | 5.2 | 5.4 | 5.5 |
Profit before taxes | -2.2 | -1.1 | 4.0 | 3.5 | 9.4 | 3.7 | 4.1 | 4.3 |
Net income | -2.2 | -0.6 | 3.2 | 3.6 | 7.8 | 2.4 | 2.6 | 2.7 |
EPS (adj.) | -0.37 | -0.10 | 0.50 | 0.56 | 1.23 | 0.37 | 0.41 | 0.43 |
growth-% | -234.4 % | 11.5 % | 120.2 % | -69.6 % | 9.0 % | 5.4 % | ||
Dividend | 0.27 | 1.29 | 0.31 | 0.33 | 0.35 | 0.37 | 0.39 | 0.41 |
Dividend ratio | -72.5 % | -1,282.0 % | 61.6 % | 59.1 % | 28.5 % | 99.1 % | 95.9 % | 95.6 % |
Profitability and return on capital
2020 | 2021 | 2022 | 2023 | 2024e | 2025e | 2026e | 2027e | |
---|---|---|---|---|---|---|---|---|
EBITDA-% | -11.0 % | -4.9 % | 56.0 % | 56.8 % | 108.7 % | 47.0 % | 47.2 % | 47.4 % |
EBIT-% (adj.) | -11.0 % | -4.9 % | 56.0 % | 56.8 % | 108.7 % | 47.0 % | 47.2 % | 47.4 % |
EBIT-% | -11.0 % | -4.9 % | 56.0 % | 56.8 % | 108.7 % | 47.0 % | 47.2 % | 47.4 % |
ROE | -5.3 % | -1.7 % | 9.4 % | 10.8 % | 21.5 % | 6.0 % | 6.5 % | 6.9 % |
ROI | -1.2 % | -0.8 % | 7.8 % | 7.6 % | 16.2 % | 6.3 % | 6.5 % | 6.8 % |
Valuation
2020 | 2021 | 2022 | 2023 | 2024e | 2025e | 2026e | 2027e | |
---|---|---|---|---|---|---|---|---|
Share price (EUR) | 5.70 | 5.58 | 4.80 | 5.20 | 5.30 | 5.30 | 5.30 | 5.30 |
Shares | 5.9 | 6.2 | 6.4 | 6.4 | 6.4 | 6.4 | 6.4 | 6.4 |
Market cap | 33.9 | 34.5 | 30.7 | 33.1 | 33.8 | 33.8 | 33.8 | 33.8 |
Enterprise value | 52.1 | 38.9 | 42.9 | 41.4 | 64.2 | 64.0 | 63.9 | 63.9 |
EV/S | 5.5 | 4.0 | 5.6 | 6.0 | 6.4 | 5.8 | 5.6 | 5.5 |
EV/EBITDA | - | - | 10.1 | 10.6 | 5.9 | 12.3 | 11.9 | 11.6 |
EV/EBIT (adj.) | - | - | 10.1 | 10.6 | 5.9 | 12.3 | 11.9 | 11.6 |
EV/EBIT | - | - | 10.1 | 10.6 | 5.9 | 12.3 | 11.9 | 11.6 |
P/E (adj.) | - | - | 9.6 | 9.3 | 4.3 | 14.2 | 13.0 | 12.4 |
P/E | - | - | 9.6 | 9.3 | 4.3 | 14.2 | 13.0 | 12.4 |
P/B | 0.9 | 1.0 | 1.0 | 1.0 | 0.9 | 0.9 | 0.9 | 0.8 |
P/S | 3.6 | 3.5 | 4.0 | 4.8 | 3.4 | 3.0 | 3.0 | 2.9 |
Dividend yield | 4.7 % | 23.1 % | 6.5 % | 6.4 % | 6.6 % | 7.0 % | 7.4 % | 7.7 % |
Equity ratio | 54.9 % | 57.8 % | 58.9 % | 63.4 % | 49.5 % | 49.7 % | 50.2 % | 50.9 % |
Gearing ratio | 51.0 % | 12.1 % | 37.5 % | 24.4 % | 64.8 % | 64.0 % | 63.6 % | 63.2 % |
Quarter data
Q4/23 | 2023 | Q1/24 | Q2/24 | Q3/24 | Q4/24e | 2024e | Q1/25e | Q2/25e | |
---|---|---|---|---|---|---|---|---|---|
Revenue | 1.8 | 6.9 | 1.6 | 3.1 | 2.4 | 2.9 | 10.0 | ||
EBITDA | 0.0 | 3.9 | 1.0 | 7.7 | 1.0 | 1.2 | 10.9 | ||
EBIT | 0.0 | 3.9 | 1.0 | 7.7 | 1.0 | 1.2 | 10.9 | ||
Profit before taxes | -0.1 | 3.5 | 0.8 | 7.1 | 0.7 | 0.8 | 9.4 | ||
Net income | 0.1 | 3.6 | 0.8 | 5.6 | 0.9 | 0.5 | 7.8 |
ShowingAll content types
Investors House, Puolivuosikatsaus H1 2024
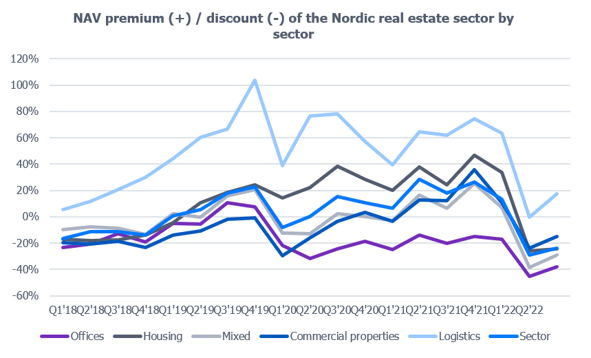
More challenging operating environment reflected in the valuation of the Nordic real estate sector
Join Inderes community
Don't miss out - create an account and get all the possible benefits
Inderes account
Followings and notifications on followed companies
Analyst comments and recommendations
Stock comparison tool & other popular tools