H&M
155.4
SEK
+1.2 %
HM B
NASDAQ Stockholm
Personal Goods
Consumer Goods & Services
3,711 following
+1.2%
-10.56%
-4.52%
-17.36%
-12.01%
-7.79%
-3.73%
-14.43%
+6,583.87%
hmgroup.com/investors
Hennes & Mauritz is a retail chain. The range consists of clothing, shoes, and accessories. The group also includes brands such as COS, Monki, Weekday, Cheap Monday, and Other Stories. Today, the company also conducts business in home furnishings via H&M Home. The company has a presence in all global regions. H&M was originally founded in 1947 and is headquartered in Stockholm, Sweden.
P/E (adj.) (24e)
21.34
EV/EBIT (adj.) (24e)
17.57
P/B (24e)
5.13
Dividend yield-% (24e)
4.34 %
Target price
170.00 SEK
Recommendation
Reduce
Updated
27.9.2024
NASDAQ Stockholm
HM B
Daily low / high price
154.35 / 156.45
SEK
Market cap
250.28B SEK
Turnover
396.96M SEK
Volume
2.6M
Business risk
Valuation risk
Current
Previous
Latest research
Extensive report
Inderes' extensive report is an investor's handbook on customer companies covered by our research.
The latest extensive report was released
Read the reportAnalyst
Rauli Juva
Analyst
Latest videos
Financial calendar
Annual report
2025-01-30
Interim report
2025-03-27
General meeting
2025-05-07
Major OwnersSource: Millistream Market Data AB
Owner | Capital | Votes |
---|---|---|
Stefan Persson and family | 60.7 % | 81.2 % |
Lottie Tham | 5.5 % | 2.6 % |
State Street Bank And Trust Co, W9 | 2.5 % | 1.2 % |
AMF - Försäkring och Fonder | 2.4 % | 1.2 % |
Swedbank Robur fonder | 1.3 % | 0.6 % |
Fjärde AP-fonden | 1.3 % | 0.6 % |
Handelsbanken Fonder | 1.3 % | 0.6 % |
JPM CHASE NA | 1.3 % | 0.6 % |
Nordea Investment Funds | 1.1 % | 0.5 % |
Alecta Tjänstepension Ömsesidigt | 0.8 % | 0.4 % |
Forum updates
Sammanfattning på nuläget i videoformat:
9/4/2024, 11:17 AM💙 3
Income statement
2020 | 2021 | 2022 | 2023 | 2024e | 2025e | 2026e | 2027e | |
---|---|---|---|---|---|---|---|---|
Revenue | 187,031.0 | 198,967.0 | 223,553.0 | 236,035.0 | 236,585.0 | 247,445.0 | 260,926.0 | 273,599.0 |
growth-% | -19.6 % | 6.4 % | 12.4 % | 5.6 % | 0.2 % | 4.6 % | 5.4 % | 4.9 % |
EBITDA | 29,052.0 | 37,575.0 | 29,748.0 | 37,492.0 | 38,866.0 | 44,776.1 | 47,412.0 | 48,758.0 |
EBIT (adj.) | 3,099.0 | 15,255.0 | 9,760.0 | 13,538.0 | 17,360.0 | 22,006.8 | 24,605.6 | 25,750.6 |
EBIT | 3,099.0 | 15,255.0 | 7,169.0 | 14,537.0 | 17,161.0 | 22,006.8 | 24,605.6 | 25,750.6 |
Profit before taxes | 2,052.0 | 14,300.0 | 6,216.0 | 13,010.0 | 15,388.0 | 20,506.8 | 23,405.6 | 25,250.6 |
Net income | 1,243.0 | 11,010.0 | 3,566.0 | 8,723.0 | 11,524.8 | 15,482.6 | 17,671.3 | 19,064.2 |
EPS (adj.) | 0.75 | 6.65 | 3.74 | 4.73 | 7.28 | 9.65 | 11.01 | 11.88 |
growth-% | -90.8 % | 785.8 % | -43.8 % | 26.4 % | 54.0 % | 32.5 % | 14.1 % | 7.9 % |
Dividend | 0.00 | 6.50 | 6.50 | 6.50 | 6.75 | 7.50 | 8.50 | 11.88 |
Dividend ratio | 97.7 % | 299.8 % | 120.9 % | 94.0 % | 77.7 % | 77.2 % | 100.0 % |
Profitability and return on capital
2020 | 2021 | 2022 | 2023 | 2024e | 2025e | 2026e | 2027e | |
---|---|---|---|---|---|---|---|---|
EBITDA-% | 15.5 % | 18.9 % | 13.3 % | 15.9 % | 16.4 % | 18.1 % | 18.2 % | 17.8 % |
EBIT-% (adj.) | 1.7 % | 7.7 % | 4.4 % | 5.7 % | 7.3 % | 8.9 % | 9.4 % | 9.4 % |
EBIT-% | 1.7 % | 7.7 % | 3.2 % | 6.2 % | 7.3 % | 8.9 % | 9.4 % | 9.4 % |
ROE | 2.2 % | 19.2 % | 6.4 % | 17.7 % | 24.0 % | 30.4 % | 31.5 % | 31.0 % |
ROI | 3.0 % | 11.7 % | 5.7 % | 11.7 % | 13.7 % | 17.4 % | 19.4 % | 20.0 % |
Valuation
2020 | 2021 | 2022 | 2023 | 2024e | 2025e | 2026e | 2027e | |
---|---|---|---|---|---|---|---|---|
Share price (SEK) | 172.00 | 178.80 | 112.20 | 177.56 | 155.40 | 155.40 | 155.40 | 155.40 |
Shares | 1,655.1 | 1,655.1 | 1,645.0 | 1,622.0 | 1,604.5 | 1,604.5 | 1,604.5 | 1,604.5 |
Market cap | 284,672.0 | 295,926.5 | 184,569.0 | 288,002.3 | 249,339.3 | 249,339.3 | 249,339.3 | 249,339.3 |
Enterprise value | 348,197.0 | 335,146.5 | 235,497.0 | 339,574.3 | 304,991.5 | 304,036.0 | 303,147.2 | 302,916.6 |
EV/S | 1.9 | 1.7 | 1.1 | 1.4 | 1.3 | 1.2 | 1.2 | 1.1 |
EV/EBITDA | 12.0 | 8.9 | 7.9 | 9.1 | 7.8 | 6.8 | 6.4 | 6.2 |
EV/EBIT (adj.) | 112.4 | 22.0 | 24.1 | 25.1 | 17.6 | 13.8 | 12.3 | 11.8 |
EV/EBIT | 112.4 | 22.0 | 32.8 | 23.4 | 17.8 | 13.8 | 12.3 | 11.8 |
P/E (adj.) | 229.0 | 26.9 | 30.0 | 37.6 | 21.3 | 16.1 | 14.1 | 13.1 |
P/E | 229.0 | 26.9 | 51.8 | 33.3 | 21.7 | 16.1 | 14.1 | 13.1 |
P/B | 5.2 | 4.9 | 3.6 | 6.1 | 5.1 | 4.7 | 4.2 | 3.9 |
P/S | 1.5 | 1.5 | 0.8 | 1.2 | 1.1 | 1.0 | 1.0 | 0.9 |
Dividend yield | 3.6 % | 5.8 % | 3.7 % | 4.3 % | 4.8 % | 5.5 % | 7.6 % | |
Equity ratio | 31.3 % | 33.4 % | 27.9 % | 26.3 % | 27.2 % | 29.3 % | 32.5 % | 34.2 % |
Gearing ratio | 116.3 % | 65.3 % | 100.3 % | 108.3 % | 114.6 % | 102.7 % | 91.4 % | 83.3 % |
Quarter data
Q4/23 | 2023 | Q1/24 | Q2/24 | Q3/24 | Q4/24e | 2024e | Q1/25e | Q2/25e | |
---|---|---|---|---|---|---|---|---|---|
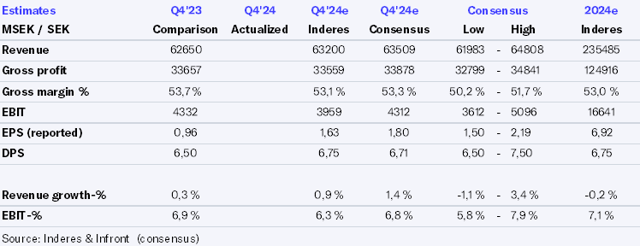
Revenue | 62,650.0 | 236,035.0 | 53,669.0 | 59,605.0 | 59,011.0 | 64,300.0 | 236,585.0 | ||
EBITDA | 10,562.0 | 37,492.0 | 7,480.0 | 12,526.0 | 8,881.0 | 9,979.0 | 38,866.0 | ||
EBIT | 4,332.0 | 14,537.0 | 2,077.0 | 7,098.0 | 3,507.0 | 4,479.0 | 17,161.0 | ||
Profit before taxes | 3,916.0 | 13,010.0 | 1,606.0 | 6,668.0 | 3,085.0 | 4,029.0 | 15,388.0 | ||
Net income | 1,576.0 | 8,723.0 | 1,201.0 | 4,995.0 | 2,307.0 | 3,021.8 | 11,524.8 |
ShowingAll content types
H & M Hennes & Mauritz AB: Buybacks of shares by H&M during week 46, 2024
H & M Hennes & Mauritz AB: Buybacks of shares by H&M during week 45, 2024
Join Inderes community
Don't miss out - create an account and get all the possible benefits
Inderes account
Followings and notifications on followed companies
Analyst comments and recommendations
Stock comparison tool & other popular tools