Componenta
4.19
EUR
-2.56 %
4,058 following
CTH1V
NASDAQ Helsinki
Industrial Goods & Services
Industrials
Overview
Financials & Estimates
Investor consensus
-2.56%
+11.73%
+51.26%
+51.81%
+29.72%
+67.6%
+36.93%
+31.85%
-96.48%
Componenta is a manufacturing company. The company is a supplier of casting solutions that are also used in a number of industrial vehicles, mainly trucks and larger machines. In addition to the main business, associated engineering services are offered. Componenta operates worldwide with the largest presence around the European market. The head office is located in Vantaa.
Read moreMarket cap
40.73M EUR
Turnover
92.87K EUR
P/E (adj.) (25e)
45.67
EV/EBIT (adj.) (25e)
19.03
P/B (25e)
1.52
EV/S (25e)
0.41
Dividend yield-% (25e)
0.95 %

Revenue and EBIT-%
Revenue M
EBIT-% (adj.)
EPS and dividend
EPS (adj.)
Dividend %
Financial calendar
23/4
2025
General meeting '25
9/5
2025
Business review Q1'25
23/7
2025
Interim report Q2'25
Risk
Business risk
Valuation risk
Low
High
All
Research
Press releases
ShowingAll content types
Inside information: Componenta agreed on two financing arrangements with Avida
Number of Shares in Componenta Corporation has Increased through Subscription with Stock Options
Join Inderes community
Don't miss out - create an account and get all the possible benefits
Inderes account
Followings and notifications on followed companies
Analyst comments and recommendations
Stock comparison tool & other popular tools
Componenta’s Annual Review and the Remuneration Report for 2024 published
Notice of the Annual General Meeting of Componenta Corporation
Componenta Q4'24: Missing clearer signs of a turnaround
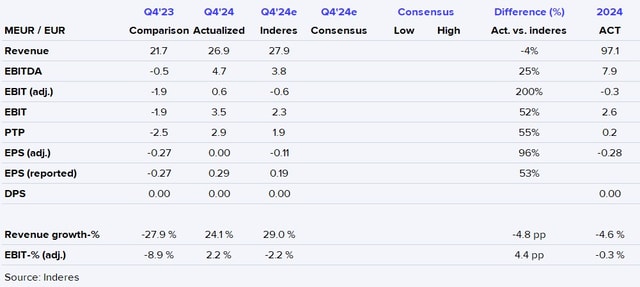
Componenta Q4'24 flash comment: Sluggish volumes less of a drag than expected
Componenta’s Financial Statements Release 1 January–31 December 2024: Net sales and EBITDA improved in the last quarter of the year
Componenta Q4'24 preview: Price increase provides opportunity to sell
Componenta Corporation: Proposals of the Shareholders’ Nomination Board to the Annual General Meeting
Componenta Corporation: Managers’ Transactions – Harri Suutari
Componenta Corporation: Managers’ Transactions – Harri Suutari
The use of the previously agreed 9 million euros option of Finnish Defence Forces was confirmed
Componenta: Unfortunate, but not very surprising
Inside information, profit warning: Componenta lowers its guidance for net sales and EBITDA for 2024
Inside information: Componenta records a non-recurring income of approximately EUR 2.9 million from the purchase of the Kalajoki plant and the Sepänkylä Machining and Service Centre for the current year's other operating income
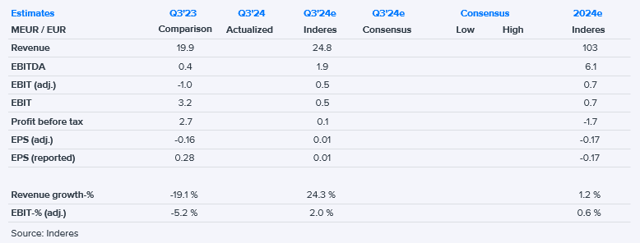
Componenta Q3'24: Stumbling but getting up again
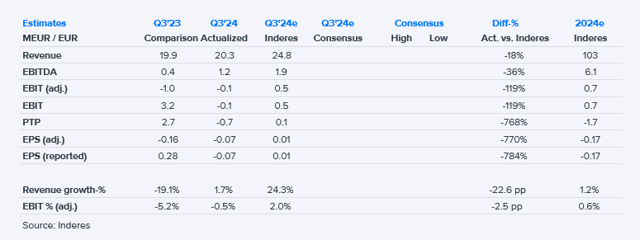
Componenta Q3'24 flash comment: Missing volumes
Componenta Corporation’s business review 1 January–30 September 2024: Net sales and EBITDA decreased despite positive developments in Q2 and Q3