Canatu
11.6
EUR
-0.85 %
CANATU
First North Finland
Hardware Manufacturer
Technology
1,450 following
-0.85%
-2.52%
+4.5%
+0.87%
+17.77%
+18.37%
+21.09%
-10.01%
-
+10.31%
canatu.com/investors
Canatu is a technology company active in deep technology that creates carbon nanotubes (Canatu CNT), related products and manufacturing equipment for the semiconductor, automotive and medical diagnostics industries. The company operates through two business models, firstly using their own reactors to develop and manufacture CNT products. Second, the company sells its CNT reactors and licenses its related technology, allowing customers to produce the products themselves under a limited license.
P/E (adj.) (24e)
-128.12
EV/EBIT (adj.) (24e)
-89.76
EV/S (24e)
13.54
Dividend yield-% (24e)
-
Target price
13.00 EUR
Recommendation
Accumulate
Updated
21.10.2024
First North Finland
CANATU
Daily low / high price
11.5 / 11.8
EUR
Market cap
398.89M EUR
Turnover
43.11K EUR
Volume
3.7K
Business risk
Valuation risk
Current
Previous
Latest research
Analyst
Atte Riikola
Analyst
Latest videos
Financial calendar
Annual report
2025-03-28
General meeting
2025-05-15
Income statement
2020 | 2021 | 2022 | 2023 | 2024e | 2025e | 2026e | 2027e | |
---|---|---|---|---|---|---|---|---|
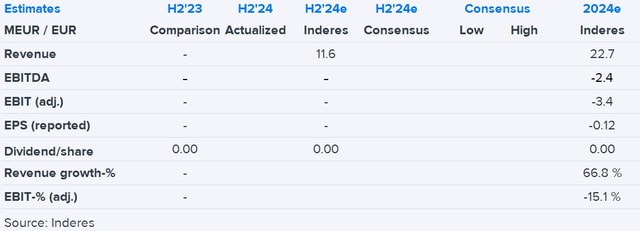
Revenue | 1.5 | 5.5 | 8.4 | 13.6 | 22.7 | 30.3 | 41.3 | 81.8 |
growth-% | 37,400.0 % | 263.7 % | 53.7 % | 62.1 % | 66.8 % | 33.6 % | 36.4 % | 98.0 % |
EBITDA | -5.7 | -2.9 | -1.8 | 0.3 | -2.4 | -0.0 | 2.5 | 23.8 |
EBIT (adj.) | -6.5 | -3.7 | -2.4 | -0.6 | -3.4 | -2.4 | -0.4 | 20.3 |
EBIT | -6.5 | -3.7 | -2.4 | -0.6 | -3.4 | -3.0 | -1.0 | 19.7 |
Profit before taxes | -6.8 | -3.9 | -3.0 | -1.3 | -5.0 | -2.3 | -0.4 | 20.3 |
Net income | -6.8 | -3.9 | -3.0 | -1.3 | -4.0 | -1.8 | -0.3 | 16.2 |
EPS (adj.) | -0.20 | -0.12 | -0.09 | -0.04 | -0.09 | -0.04 | 0.01 | 0.49 |
growth-% | 6,330.5 % | |||||||
Dividend | 0.00 | 0.00 | 0.00 | 0.00 | 0.00 | 0.00 | 0.00 | 0.00 |
Dividend ratio |
Profitability and return on capital
2020 | 2021 | 2022 | 2023 | 2024e | 2025e | 2026e | 2027e | |
---|---|---|---|---|---|---|---|---|
EBITDA-% | -381.7 % | -53.4 % | -21.3 % | 2.0 % | -10.7 % | -0.0 % | 6.1 % | 29.0 % |
EBIT-% (adj.) | -433.4 % | -67.1 % | -29.1 % | -4.7 % | -15.1 % | -7.9 % | -1.0 % | 24.8 % |
EBIT-% | -433.4 % | -67.1 % | -29.1 % | -4.7 % | -15.1 % | -9.8 % | -2.4 % | 24.1 % |
ROE | -242.3 % | -108.3 % | -66.8 % | -2.2 % | -3.6 % | -1.7 % | -0.3 % | 14.1 % |
ROI | -79.2 % | -25.8 % | -14.3 % | -0.9 % | -2.9 % | -2.0 % | -0.3 % | 17.6 % |
Valuation
2020 | 2021 | 2022 | 2023 | 2024e | 2025e | 2026e | 2027e | |
---|---|---|---|---|---|---|---|---|
Share price (EUR) | 13.00 | 10.05 | 9.80 | 11.60 | 11.60 | 11.60 | 11.60 | |
Shares | 34.0 | 34.0 | 34.0 | 34.0 | 34.0 | 34.0 | 34.0 | 34.0 |
Market cap | 441.5 | 341.3 | 332.8 | 394.0 | 394.0 | 394.0 | 394.0 | |
Enterprise value | 443.4 | 340.0 | 234.6 | 306.9 | 312.0 | 315.8 | 304.1 | |
EV/S | - | 81.3 | 40.6 | 17.3 | 13.5 | 10.3 | 7.6 | 3.7 |
EV/EBITDA | - | - | - | 844.0 | - | - | 124.6 | 12.8 |
EV/EBIT (adj.) | - | - | - | - | - | - | - | 15.0 |
EV/EBIT | - | - | - | - | - | - | - | 15.4 |
P/E (adj.) | - | - | - | - | - | - | 1,507.1 | 23.4 |
P/E | - | - | - | - | - | - | - | 24.2 |
P/B | - | 265.2 | 47.1 | 2.9 | 3.6 | 3.7 | 3.7 | 3.2 |
P/S | - | 80.9 | 40.7 | 24.5 | 17.4 | 13.0 | 9.5 | 4.8 |
Dividend yield | ||||||||
Equity ratio | 31.4 % | 11.4 % | 29.5 % | 90.4 % | 93.7 % | 93.5 % | 92.5 % | 89.3 % |
Gearing ratio | -20.1 % | 113.8 % | -17.7 % | -86.9 % | -79.8 % | -76.4 % | -73.1 % | -72.9 % |
Quarter data
Q3/23 | Q4/23 | 2023 | Q1/24 | Q2/24 | Q3/24e | Q4/24e | 2024e | Q1/25e | |
---|---|---|---|---|---|---|---|---|---|
Revenue | 13.6 | 13.6 | 11.1 | 11.6 | 22.7 | ||||
EBITDA | 0.3 | 0.3 | 0.5 | -2.9 | -2.4 | ||||
EBIT | -0.6 | -0.6 | -3.4 | -3.4 | |||||
Profit before taxes | -1.3 | -1.3 | -0.4 | -4.6 | -5.0 | ||||
Net income | -1.3 | -1.3 | -0.3 | -3.7 | -4.0 |
ShowingAll content types
Conversion of Canatu Plc’s series C shares to series A shares
Canatu: Carefully aboard the growth story
Join Inderes community
Don't miss out - create an account and get all the possible benefits
Inderes account
Followings and notifications on followed companies
Analyst comments and recommendations
Stock comparison tool & other popular tools